
Most Mutual Fund Investors Get Lost in the World of Various Equity Fund Categories Like LIKE LARGE CAP, Flexi-Cap, Midcap, Small-CAP, Focused Funds, Multi-Cap, Focused Funds, Multi-Cap, and Whatnot.
Do Investors Keep Wondering which category will provide the best returns over the long term? And in real life i have also also after the investors out of their ignaurance compare with the senses or nifty as that the most benchmark to compare utna accha nahi performance kar raha)
So here is what i did
I Downloaded 9 Equity Categories Mutual Funds from Advisorkhoj.com and Sorted them on the Basis of the last 10 yrs’ returns and found out how much a one-ticket a ticket a ticket. In this period senses went from 17700 levels to 60,000 Er is the Situation, I am doing it). This turned out to be Approx 12.98% Cagr Return and Rs 10 Lacs Became 33.94 LACS.
Before I go into charts and data, let me admit that this is not the “right” analysis as such and with some flows. However, it reflects how many novice investors look at data. Some Important Disclaimer and Important Points I MUST SHARE BEFORE You E-LYNCH Me in the comments Section for my stupidity.
Disclaimer and Important Points
- This post is simply the data presentation of the data and not some analysis of which is the better or bad funds.
- The article Simply Tells you about what has been in the past and does not predict anything about the future.
- Mutual Fund Sebi Categorization was done on October 6, 2017, but the fund performance data was taken before as it is, accuse that’s the current situation.
- Not all funds categories was fixed from start. Some Funds Exchanged Hands from one category to another and their mandate was also changed. But we will let it be for creating the charts
- Some very famous funds are not part of this analysis as they have not completed 10 yrs.
- While the fund benchmark is different for each category, I am simply Creaking a simple comparison of which funds have at Least Created More Wealth Than Sensex.
Funds Category Considered
- Large cap funds
- Large and Midcap Funds
- Midcap funds
- Small Cap Funds
- Multicap funds
- Focused funds
- ELSS Funds
- Flexicap funds
- Index Funds
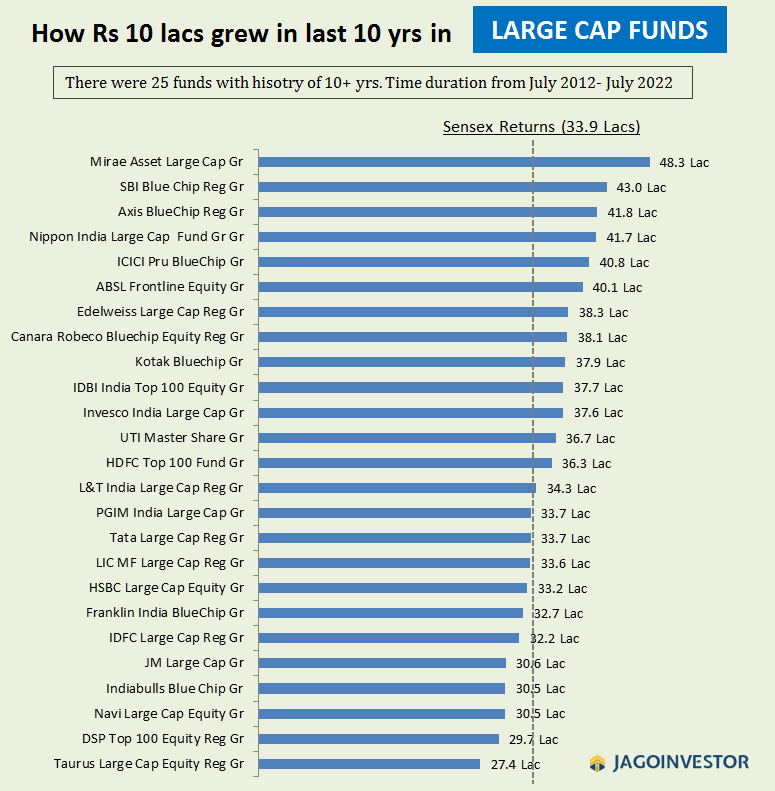
Category #1: Large Cap Funds
There was 25 funds in this category with 10+ yrs of data available. The Topmost Fund Returned 48.3 Lacs for the Investment of 10 Lacs and the West Did Return 27.4 Lacs. Here is the data in the chart.

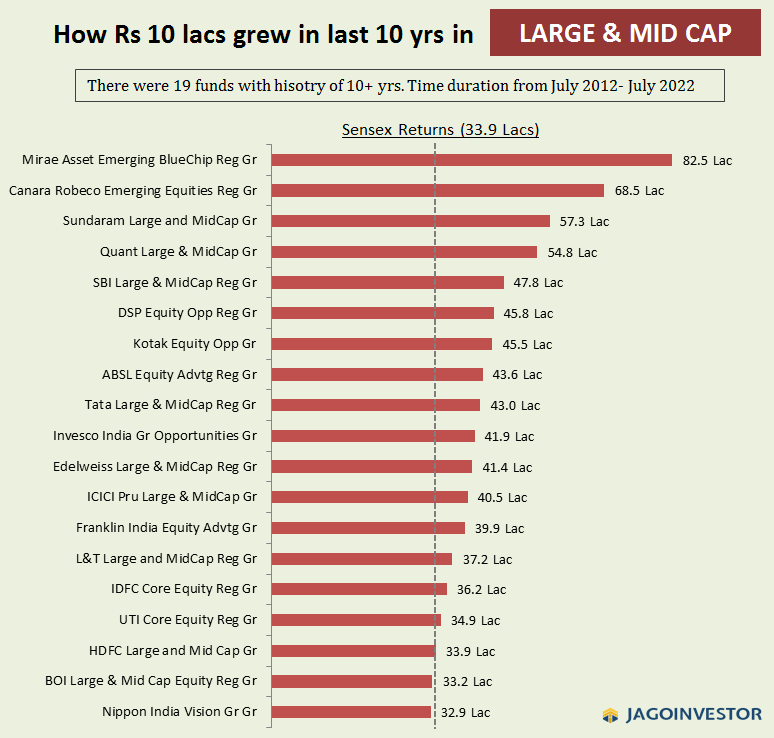
Category #2: Large and Mid Cap Funds
There were 20 funds in this category with 10+ yrs of data available. The Topmost Fund Returned 82.5 Lacs for the Investment of 10 Lacs and the WORST did return 32.9 lacs. Here is the data in the chart.
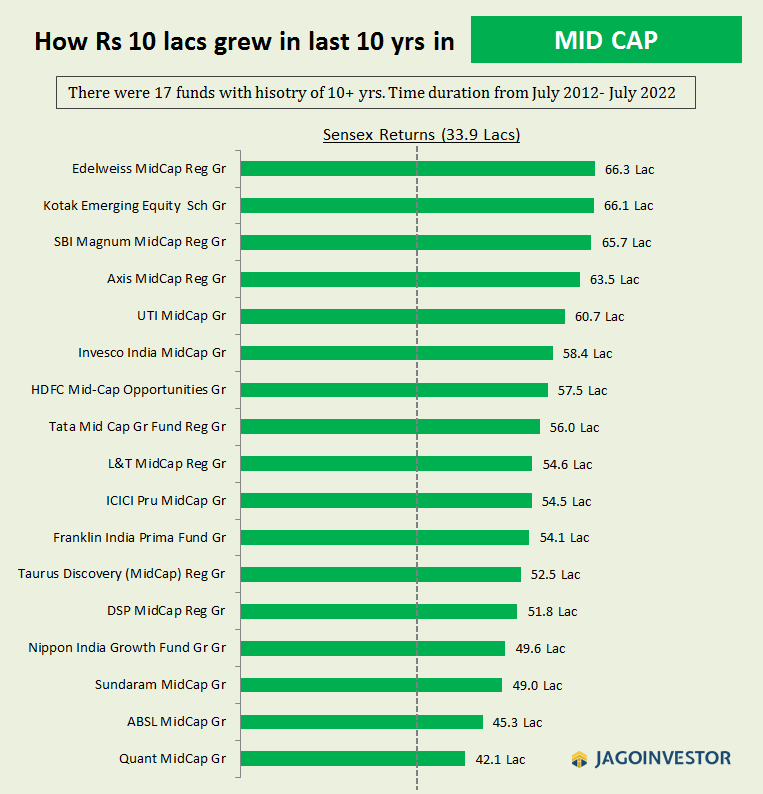
Category #3: Mid Cap Funds
There was 17 funds in this category with 10+ yrs of data available. The Topmost Fund Returned 66.3 Lacs for the Investment of 10 Lacs and the West Did Return 42.1 Lacs. Here is the data in the chart.
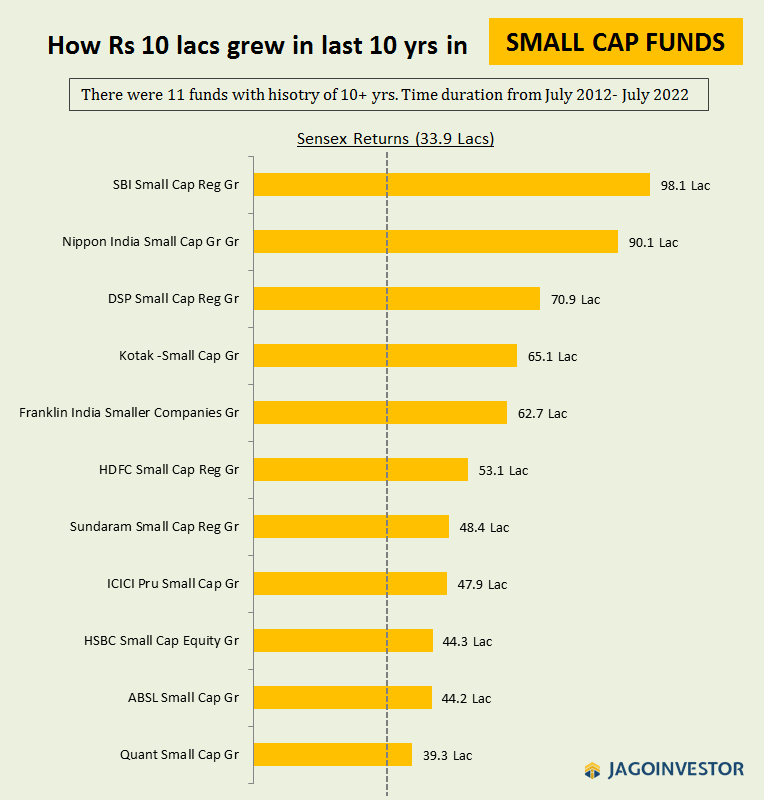
Category #4: Small Cap Funds
There was 11 funds in this category with 10+ yrs of data available. The Topmost Fund Returned 98.1 Lacs for the Investment of 10 Lacs and the West Did Return 39.3 Lacs. Here is the data in the chart.
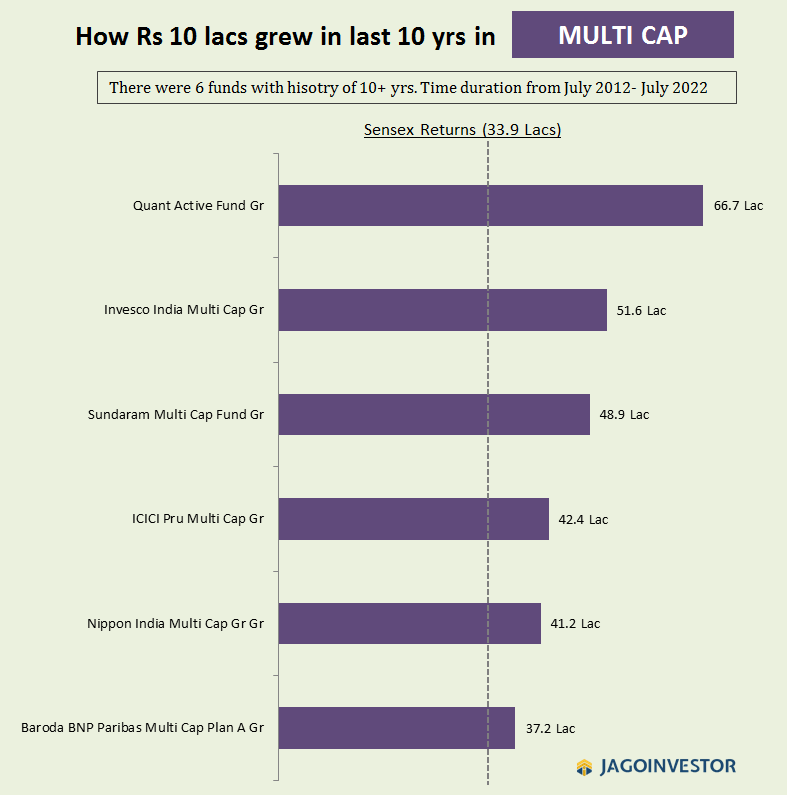
Category #5: Multicap Funds
There was 6 funds in this category with 10+ yrs of data available. The Topmost Fund Returned 66.7 Lacs for the Investment of 10 Lacs and the WOST DID RETURN 37.2 LACS. Here is the data in the chart.
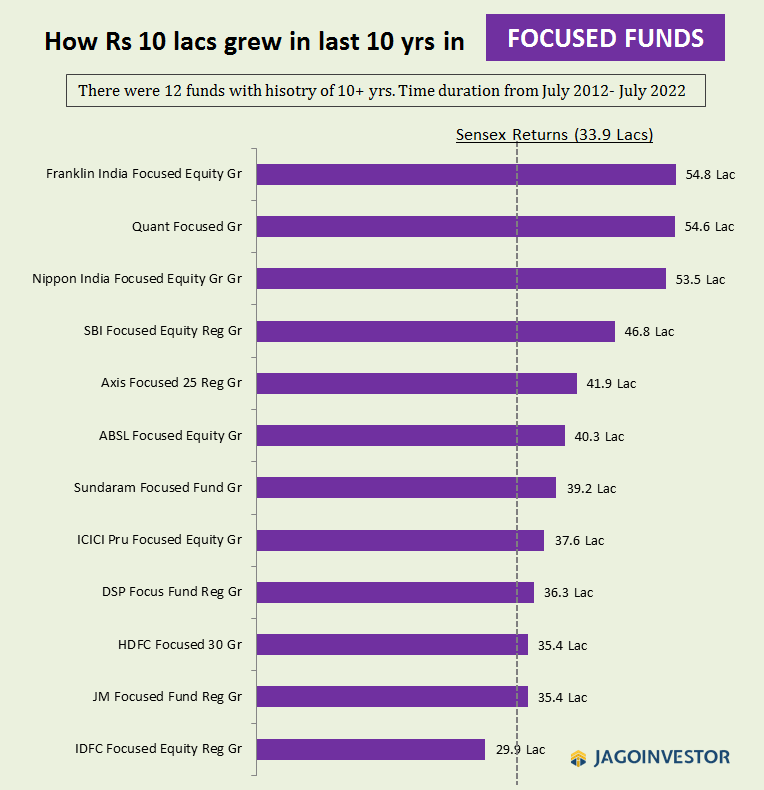
Category #6: Focused Funds
There was 12 funds in this category with 10+ yrs of data available. The Topmost Fund Returned 54.8 Lacs for the Investment of 10 Lacs and the West Did Return 29.9 LACS. Here is the data in the chart.
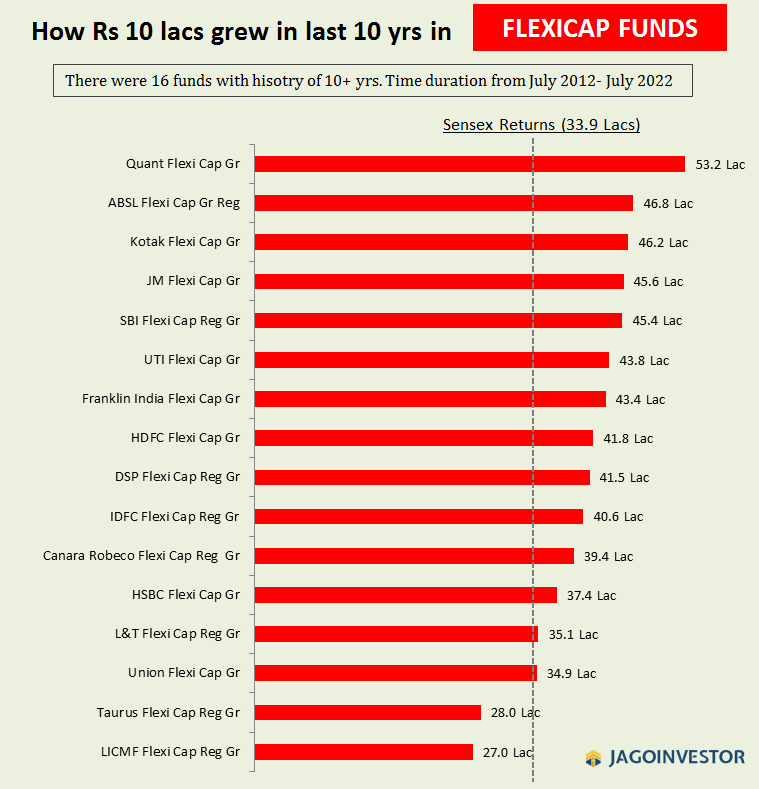
Category #7: Flexicap Funds
There was 16 funds in this category with 10+ yrs of data available. The Topmost Fund Returned 53.2 Lacs for the Investment of 10 Lacs and the West Did Return 27 LACS. Here is the data in the chart.
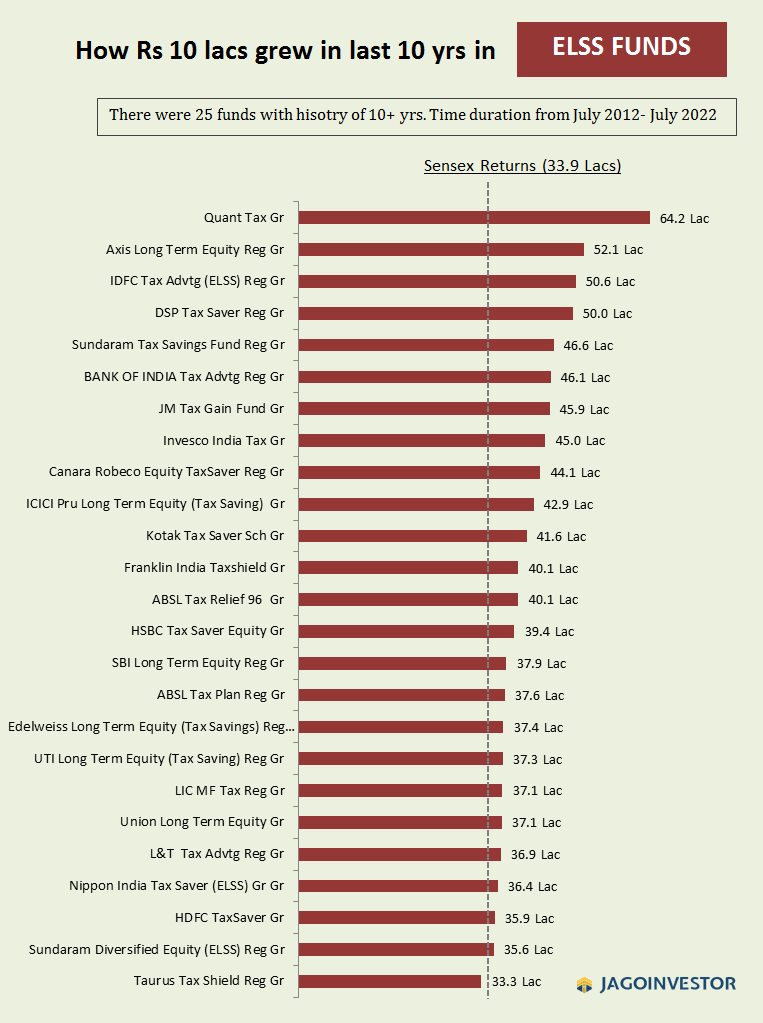
Category #8: ELSS / Taxsver Funds
There was 25 funds in this category with 10+ yrs of data available. The Topmost Fund Returned 64.2 Lacs for the Investment of 10 Lacs and the West Did Return 33.3 Lacs. Here is the data in the chart.
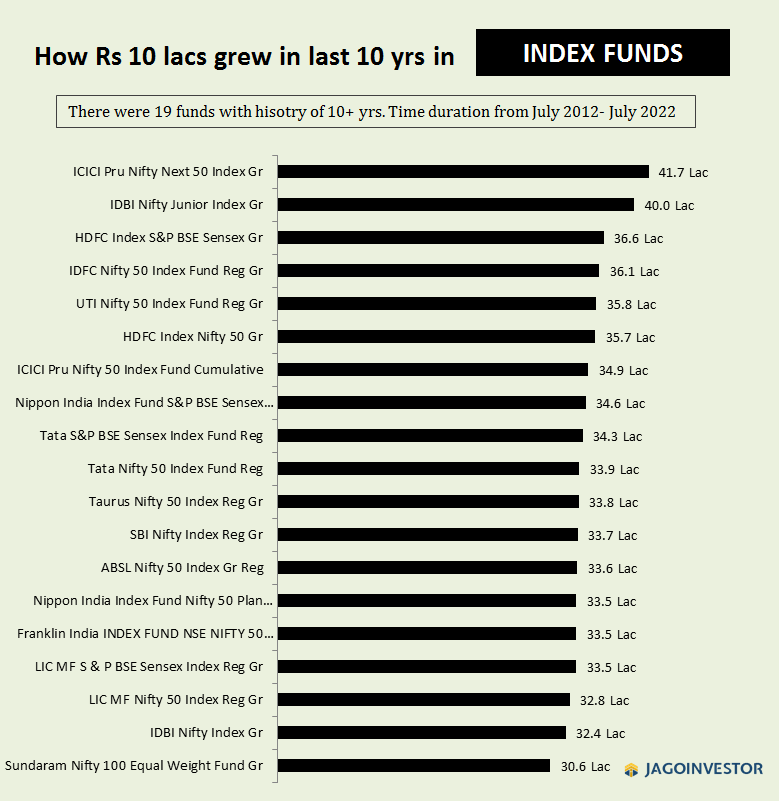
Category #9: Index Funds
There were 19 funds in this category with 10+ yrs of data available. The Topmost Fund Returned 41.7 Lacs for the Investment of 10 Lacs and the Worst Did Return 30.6 LACS. Here is the data in the chart.
Looking at all the funds in one frame
Let us put all the funds into one single chart to see which category returns have been got
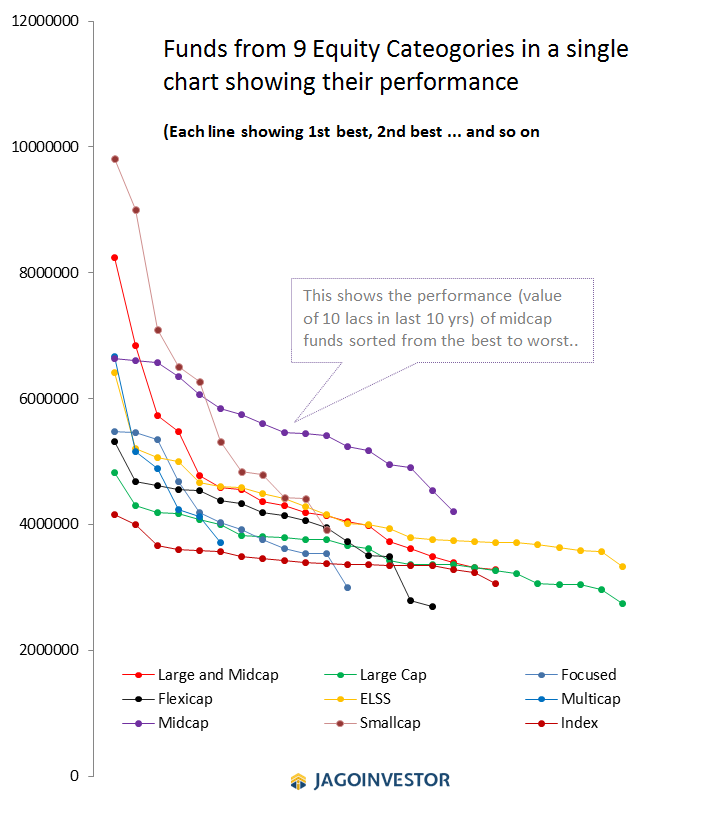
There is no conclusion I am making from the data and chart in this article, as there are many issues with the fund’s category. You are free to make wheatver infererance you want to make out of this data.
Do leave a comment below with what has surprised and not surprised you about the data.